By: Denekew A. Jembere
 Licensed under a Creative Commons Attribution-NonCommercial-ShareAlike 4.0 International License.
Introduction
For sustainable development efforts, timely and relatively accurate data plays a pivotal role in resource allocation and utilization. Household surveys are the most common and critical sources of information for decisions in sustainable developmental efforts. However, due to both technical and economic reasons, collecting and maintaining a complete and timely household survey data is not feasible in most middle- and low-income countries. As a result, government agencies, researchers, and Non-Governmental Organizations (NGOs) are trying to investigate different approaches of collecting complementary data from varying sources of big data, such as satellite imagery. This proposal will, therefore, outline the steps and resources involved in building a Machine Learning prediction model that would provide insights for sound decisions in sustainable development efforts in the case of Ethiopia, which is one of the middle- and low-income countries, in Africa.
Problem Definition
According to the details in the World Bank database (World Bank, n.d.), Ethiopia is one of the middle- and low-income African countries with insufficient data for making sound decisions related to sustainable developmental efforts. Although there are 47 geospatial, 36 microdata, and 57 time-series datasets with different timeframes and indicators, from which Ethiopian related data can be extracted, most of these datasets don’t provide the proper and timely data about Ethiopia and the other middle- and low-income African countries. Due to the time-consuming and expensive household survey data collection process, the World Bank (DrivenData, 2018) has also recognized policymakers’ use of obsolete data for making important policy-related decisions.
To avoid the use of obsolete data, for measuring, tracking and predicting poverty, which the World Bank aimed to end by 2030, the World Bank held a Machine Learning based poverty prediction competition. The competition used the survey data from three different developing countries (Malawi, Namibia, and Tajikistan), with a different distribution of wealth (DrivenData, 2018), although the data used for the competing is not reported in the final repository. As a result, replicating or evaluating the process for a specific developing country, like Ethiopia, is not possible. The report (WBG, 2018) outlined the details of the advanced machine learning approaches and ensembles of different ML algorithms used by the winners of the competition.
Although the accuracies of the competition winners’ models were promising, WBG (2018) concluded that there is more work to be done for identifying important variables and making the models useful in understanding poverty, whereby reducing the number of survey questionnaires. Furthermore, the WBG called for ways of reducing data acquisition costs while maintaining highly accurate models. In this regard, we propose the use of satellite imagery and deep learning prediction approaches to complement and extend the study to the next level. In our proposed approach, in addition to reevaluating the top winner’s model in the context of Ethiopia, which was not included in the WBG competition survey data, the satellite imagery will be evaluated within the context of Ethiopia.
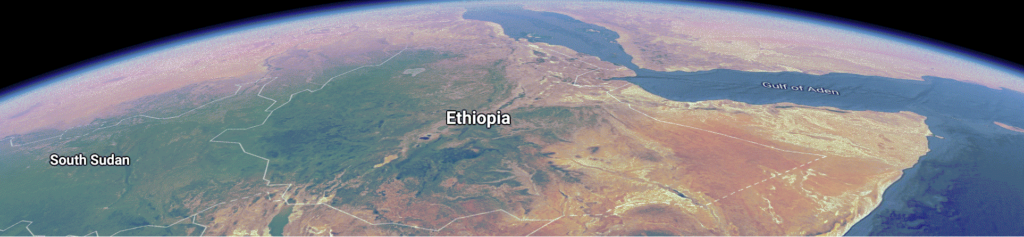
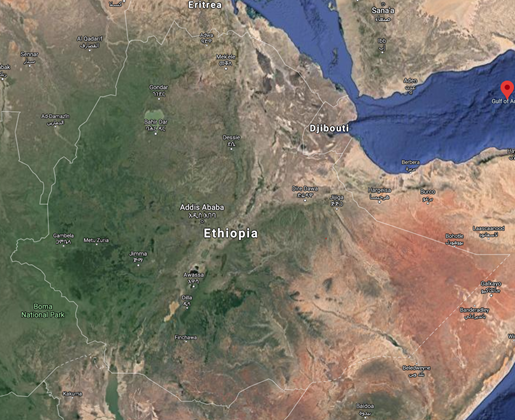
Ethiopia is the second populous, with an estimated population of 109 million (World Bank, 2019) and landlocked country located in East Africa, as shown in Figure 1. Both national and global level sustainable development efforts require accurate and timely data, especially for a country like Ethiopia. However, the household survey data, about Ethiopia, available in the World Bank data catalog are for two years (1999-2000 and 2004-2005), which are 15 years or more old (World Bank, 2017-a; World Bank, 2017-b). As a result, the poverty and development indicators and rates in the World Bank poverty & equity portal (World Bank, 2019) are based on old data. The proposed approach, ML-based poverty prediction model, can be used by national and global policymakers, for their household related policy decisions, with a near real-time data. By refreshing and reevaluating the satellite images and the model, the proposed model would cut the time and cost needed for household survey data collection.
Review of Related Literature
The use of remote sensing and satellite imagery has been widely used for studying natural phenomena and man-made structures on the ground to predict specific events, with great accuracy. Around the use of satellite-based data and other complementary data sources, studies involving machine learning algorithms to develop prediction models, used in different domains, have been reviewed. The satellite-based imagery and ML prediction related studies are briefly summarized as follows:
Severe Drought Area Prediction (SDAP)
Using satellite imagery and remote sensing, Park et al (2019) designed and proposed a severe drought area prediction (SDAP) model using a Random Forest (RF) algorithm based on Soil Moisture Index (SMI) change over time. For their study, Park et al used Landsat-8 and the Shuttle Radar Topography Mission (SRTM) data downloaded from the United States Geological Survey (USGS) EarthExplorer. For selecting the training area used in their study, Park et al used the land cover data retrieved from Korea’s Environmental Information Service. Park et al claim that their model, developed using SMI data and independent of precipitation data to avoid the meteorological uncertainties, is simple and easy to understand whereby providing useful insights for mitigation plans for drought-affected areas, under the condition of no rainfall.
Near Real-Time Soybean Yield Prediction
Using multi-temporal satellite imagery combined with weather data, Schwalbert et al (2020), proposed a model for a near real-time soybean yield prediction by using a variation of Neural Networks, Long-Short Term Memory (LSTM), machine learning algorithm. For their study, Schwalbert et al used a combination of three data sources: historical soybean yield data; Vegetation Index (VI); and, near real-time satellite images, from NASA’s Earth Observing System Data and Information System (EOSDIS). Using the EOSDIS satellite images to build a cloud-free mosaic for the selected region of the study, in southern Brazil, and the historical soybean yield data, Schwalbert et al trained the LSTM neural network model for predicting soybean yield and tested in different and yield conditions. The resolution of the EOSDIS satellite images used for the study is the Moderate Resolution Imaging Spectroradiometer (MODIS). In line with the popularity of satellite imagery as a tool for providing near-real-time prediction of crop status, Schwalbert et al indicated that satellite imagery combined with weather data can be used to develop more accurate models for predicting crop yield level. Furthermore, despite the target region of analysis, Schwalbert et al claim that their approach can possibly be applied to other geographical regions around the globe with similar availability of data.
Potential Fishing Zone (PFZ) Prediction
Using satellite-based oceanography and catch data, Zainuddin et al (2017) investigated and proposed models to determine the relationship between skipjack tuna and their environment and to predict potential fishing zones. For their study, Zainuddin et al used Moderate Resolution Imaging Spectroradiometer (MODIS) images obtained from the NASA GSFC’s Distributed Active Archive Center (DAAC) (NASA, n.d.). To predict spatial patterns of potential fishing zone, using the satellite-based oceanographic images and catch data, Zainuddin et al built statistical models by combining generalized additive model (GAM) and generalized linear model (GLM). Based on the model’s prediction result for three different locations in three consecutive months, Zainuddin et al claim that their model provides a good indicator for predicting potential fishing grounds.
Predicting Future Distribution of Land Use and Land Cover
For determining the impact of urban growth on future micro-climate of Harare through predicting the future distribution of land use and land cover, Odindi et al (2017) used medium resolution satellite Landsat series data. According to Odindi et al, due to adequate archival data, ease of access and performance in land cover classification and temperature analysis, the Landsat data is acquired from the United States Global Survey Earth Resources Observation System (USGS, n.d.). Using the multi-temporal Landsat data, Odindi et al performed radiometric and geometric corrections for retrieving the land use and land cover indices from the data to develop and evaluate Cellular Automata Markov Chain prediction model. In addition, Odindi et al explain, the land cover indices are also used to develop models for predicting land surface temperature distribution in Harare. Based on their findings, comparing different prediction models, Odindi et al concluded that the Cellular Automata Markov Chain prediction model predicted urban growth with higher accuracy.
The Data Sources and Details
The World Bank database (World Bank, n.d.) being the main source of historical household survey data, for our study, complementary geospatial and satellite imagery data will be leveraged from multiple sources. In this section, the data sources and the corresponding data to be loaded from each source are briefly summarized. Moreover, for the World Bank household survey data, the details of the different variable groups are also summarized here.
The Potential Data Sources
For this study, we will be using the following data sources to load the data, which is briefly detailed with each source. These data sources are the potential data sources, while the validity and use of each data source will be evaluated during the actual study.
- The 1999 – 2000 household and individual survey data from the World Bank data catalog (World Bank, 2017-a)
- The 2004 – 2005 household and individual survey data from the World Bank data catalog (World Bank, 2017-b)
- Data from the OpenStreetMap(OpenStreetMap, n.d.) – To get free geographic data, such as street maps, that can be associated with the household survey data
- Data from the Google Geocoding API (Google, n.d.) – to load the coordinates cities as well as the geocodes, box-bounding latitudes and longitudes, as needed.
- Ethiopian specific land cover and change data and Landsat satellite images from the Earth Resources Observation and Science (EROS) Center (USGS, n.d.)
- Ethiopian specific satellite imagery data from NASA’s Earth Observing System Data and Information System (NASA, n.d.).
Details of the Household Survey Data
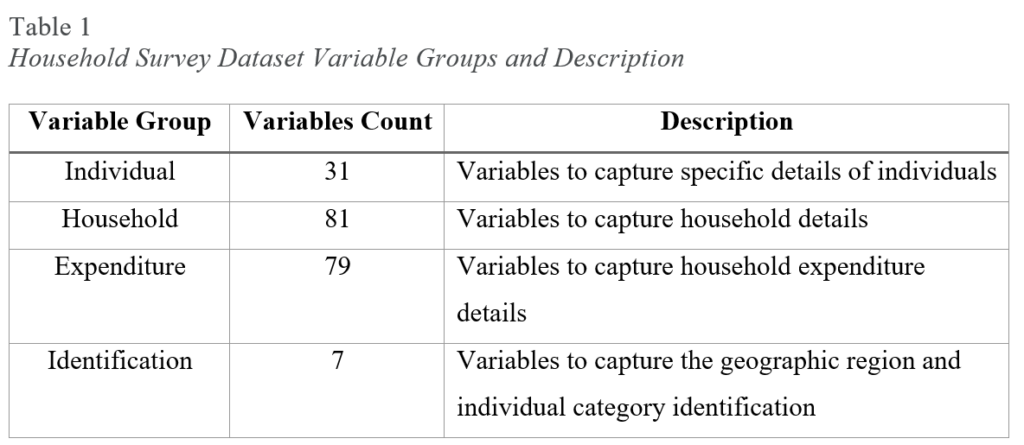
As mentioned in the problem definition, the 1999–2000 and 2004–2005 household data from the World Bank data catalog (World Bank, 2017-a; World Bank, 2017-b) is very old. However, the historical data and the variable groups used in the datasets will be used for training and testing the poverty prediction model which will also be complemented by the satellite image data for mapping structures built in the corresponding cities or villages of the households. The variable groups in both household survey datasets are summarized in Table 1.
Data Collection and Preparation
In the data collection and preparation steps, the necessary data from the data sources, identified in the earlier section, will be acquired and further data processing activities will be performed on the data. The specific details of the steps labeled in Figure 2, within the context of the problem at hand is outlined as follows:
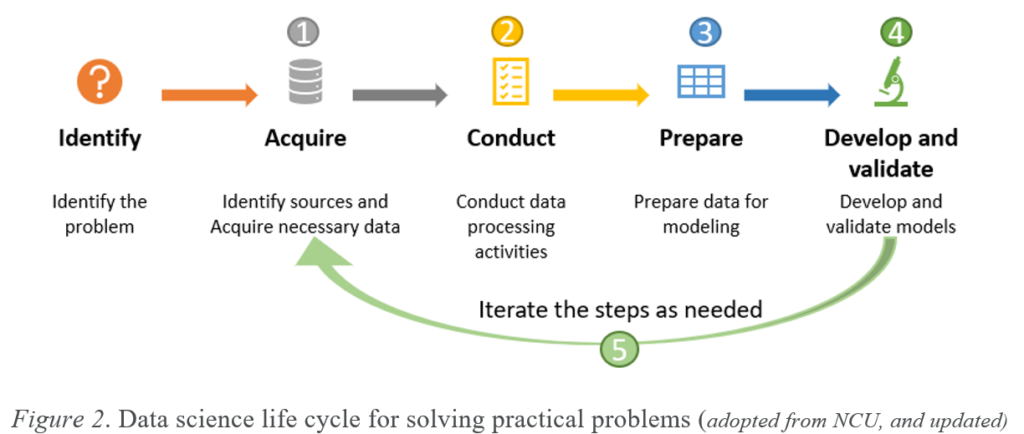
- Step – 1: The data required for building the model will be acquired in step 1. As indicated earlier, since the historical household datasets are already available, the data acquisition for the other data types will be handled in this step
- Step – 2: Once the initial data are acquired, data processing such as integrating the data from different data sources to build a consistent view of the data will be performed in the data processing step. At this step (step-2), there could be an iterative process with step-1 and sub-steps within the step itself until the meaningful dataset is created to move to step-3
- Step – 3: Using feature encoding and feature engineering algorithms, the data will be fine-tuned; and further data cleaning and dimension reduction will be performed, to limit the number of features only to the important feature sets for the model training.
- Step – 4: Once the important feature sets are identified, selection of the right algorithm for the problem identified and the data available can be performed in an iterative process. In this step, the algorithm(s) selected for model creation will be trained and tested for the prediction accuracy, and the most accurate algorithm(s) will be selected. While focusing on the accuracy of the algorithms to be selected, the interpretability of the resulting model and the prediction results will be given enough attention.
- Step – 5: Given all the reasonable features and algorithms selection iterations, if the resulting model needs new data or more data or different sets of features, this step will lead to repeat the earlier steps, as needed.
Prediction Algorithms and Models: Options
For selecting one or more prediction algorithms, it is important to note the nature of the dataset and the prediction class, which in our case is two (“poor” or “non-poor”), and the data type of the input feature sets. A brief overview of the historical household survey data shows the data types of the feature sets are both categorical and numerical. Furthermore, the satellite image data used for complementing the household data with man-made structures in the cities and villages should also be considered during algorithm selection. Therefore, the options of the ML prediction algorithms are from those that can handle input feature sets with numerical, categorical (can be encoded into numerical representations) and image data types, and with binary (poor or not-poor) classification. Based on the review of related literature coved earlier, for datasets involving a combination of satellite imagery and other data types would need two or more algorithms for creating ensemble prediction models. Therefore, in addition to the use of ensemble model creation technique, using two or more algorithms, the potential individual algorithms, and their brief descriptions, that would be evaluated for training and testing the prediction model are:
- Decision Tree Learning – This algorithm can take a discrete set of values where the leaves of the tree representing the class labels. Since this algorithm uses a tree structure, the interpretability of the model is easier.
- Random Forests – This algorithm is an ensemble learning algorithm used to train prediction or classification models through constructing multitudes of decision trees during the training process.
- Logistic Regression – This is an algorithm used to model the probability of an event or a class will take one of the two possible values (in our case “poor” or “non-poor”).
- Support Vector Machine – This algorithm is used to train a regression analysis or classification models, which could perform either linear or non-linear classifications.
- Linear Discriminant Analysis – This algorithm is a generalization of linear discriminant method and is used to train a model to classify inputs into two or more classes or events, using a linear combination of the input features.
- Deep Learning Neural Network – This algorithm is used to train a model through finding the correct mathematical manipulation to turn the input into the output, passing through multiple hidden-layers between the input and the output layers.
- Gradient Boosted Trees – This is algorithm is a variant of the decision tree of fixed size as base learners and limiting the minimum number of observations in terminal nodes.
Performance metrics for the Proposed Approach
Using the historical household survey data, about Ethiopia, available in the World Bank data catalog (World Bank, 2017-a; World Bank, 2017-b), and the relevant satellite imagery data, a prediction model will be trained and tested following the steps detailed in the data collection and preparation section. The model training and testing will involve an iterative process of applying the algorithms, which are briefly detailed in this section, and combining two or more as needed in the case of ensemble model training and testing technique. The evaluation of each model will involve measuring each of the following metrics:
- Accuracy – the model’s rate of correct prediction
- Recall – the model’s sensitivity or rate of true positive prediction
- Precision – the model’s positive predicted values.
The model with the highest values inaccuracy, recall and precision will be selected and further evaluated with domain experts in the area. With the proposed approach, the ML-based poverty prediction model will then be documented, communicated and presented for the target users, the academic community, national and global policymakers.
Considerations when selecting a model
The proposed prediction model training approach involves a huge amount and varying types of data and, the resulting model may have both strengths and weaknesses. Depending on the type of algorithms(s), from the categories of either black-box or white-box machine learning algorithms, the resulting model would have strengths or weaknesses when measured using different performance metrics and model evaluation criteria. Some of the potential strengths of the model would be the expected better performance (accuracy, recall, and precision) of the model when trained with the support vector machine (SVM) or the deep learning (DL) algorithms. On the other hand, if these (SVM or DL) algorithms are turned out to be the best performing algorithms, then the interpretability of the model will be very difficult, which could be considered as a potential weakness.
Communication and Report Detail
For communicating the details of the trained model, the steps involved in the five steps detailed, in the data collection and preparation section, and the life cycle the machine learning model training and evaluation will be documented. Among the details to be outlined in the study report will be:
- Each of the models trained, the size and type of data used, the prediction performance metrics and all other relevant details.
- The selected model for the proposed approach with the performance metrics and other relevant measures used to make the selection.
- An example use case, using a latest satellite imagery of a city/village to showcase how the model could be used in a real-life scenario.
- Potential recommendations, as well as the limitations of the study and potential future work to extend the study.
- Any additional observations and experiences from the study, and the potential contribution of the study.
References
DrivenData. (2018). Pover-T Tests: Predicting Poverty. Retrieved from Driven Data: https://www.drivendata.org/competitions/50/worldbank-poverty-prediction/page/115/
Google. (n.d.). Geocoding API. Retrieved from Google Maps Platform: https://developers.google.com/maps/documentation/geocoding/start
NASA. (n.d.). EarthData. Retrieved from Access NASA Earth Science Data: https://lpdaac.usgs.gov/
Odindi, J., Mutanga, O., Mushore, T. D., & Dube, T. (2017). Prediction of future urban surface temperatures using medium resolution satellite data in Harare metropolitan city, Zimbabwe. Building & Environment, 122, 397.
OpenStreetMap. (n.d.). Ethiopia: Openstreetmap Foundation. Retrieved from OpenStreetMap: https://www.openstreetmap.org/relation/192800
Park, H., Kim, K., & Lee, D. K. (2019). Prediction of Severe Drought Area Based on Random Forest: Using Satellite Image and Topography Data. Water (20734441), 11(4), 705.
Schwalbert, R. A., Amado, T., Corassa, G., Pott, L. P., Prasad, P. V. V., & Ciampitti, I. A. (2020). Satellite-based soybean yield forecast: Integrating machine learning and weather data for improving crop yield prediction in southern Brazil. Agricultural and Forest Meteorology, 284.
Subash, S. P., Kumar, R. R., & Aditya, K. S. (2018). Satellite data and machine learning tools for predicting poverty in rural India. Agricultural Economics Research Review, 31(2), 231–240.
USGS. (n.d.). Earth Resources Observation and Science (EROS) Center. Retrieved from USGS: Science for a changing world: https://www.usgs.gov/centers/eros
WBG. (2018, June 15). worldbank/ML-classification-algorithms-poverty. Retrieved from World Bank Group (WBG): GitHub Repository: https://github.com/worldbank/ML-classification-algorithms-poverty/tree/master/report
World Bank. (2017-a, October 31). Ethiopia – Household Income, Consumption And Expenditure Survey 1999-2000 – World Bank SHIP Harmonized Dataset. Retrieved from The World Bank: Data Catalog: https://datacatalog.worldbank.org/dataset/ethiopia-household-income-consumption-and-expenditure-survey-1999-2000-world-bank-ship
World Bank. (2017-b, October 31). Ethiopia – Household Income, Consumption And Expenditure Survey 2004-2005 – World Bank SHIP Harmonized Dataset. Retrieved from The World Bank: Data Catalog: https://datacatalog.worldbank.org/dataset/ethiopia-household-income-consumption-and-expenditure-survey-2004-2005-world-bank-ship
World Bank. (2019). Poverty & Equity Data Portal. Retrieved from The World Bank: Workng for a World Free of Poverty: http://povertydata.worldbank.org/poverty/country/ETH
World Bank. (n.d.). Search and Share Development Data. Retrieved from The World Bank: Data Catalog: https://datacatalog.worldbank.org/
Zainuddin, M., Safruddin, S., Selamat, M. B., Farhum, A., & Hidayat, S. (2017). Prediction of Potential Fishing Zones for Skipjack Tuna During the Northwest Monsoon Using Remotely Sensed Satellite Data. Ilmu Kelautan, 2, 59.
It is a good start. I appreciate your effort to do research in this subject matter!
Thank you!
it is good job.
Thanks!