By: Denekew A. Jembere
 Licensed under a Creative Commons Attribution-NonCommercial-ShareAlike 4.0 International License.
Introduction
In an organization’s short and long-term marketing strategy, it is essential to ensure the appropriate marketing efforts are used when conveying a relevant message to the appropriate customer segment in an effective and efficient manner. According to Cognizant (2014, January), acquiring new customers can cost five times more than retaining
Description and purpose
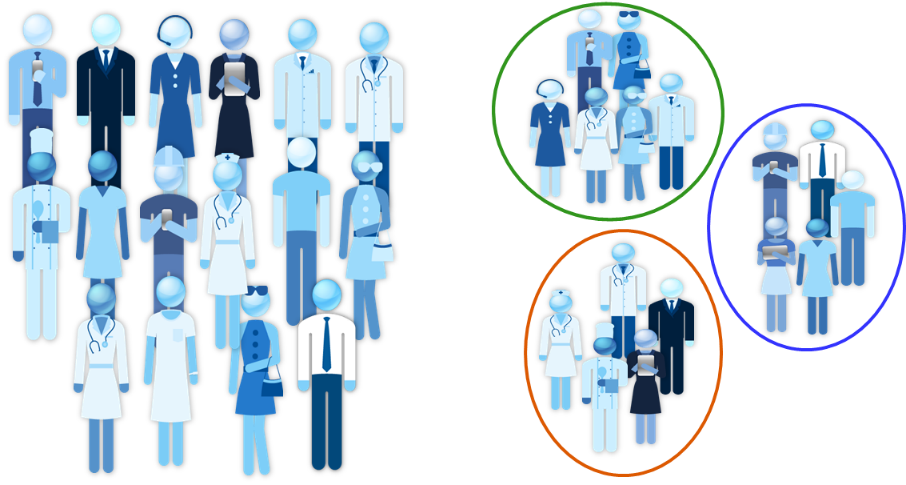
This article will outline phases of a customer loyalty analytics and data mining project that will utilize customers’ shopping data collected by a company and its chain of retail grocery stores. With an objective to create customer segmentation models and enable the company to apply the models for targeted customer promotions and offers to maintain the loyalty of customers, the article outlines specific details of the phases in such a project.
Loyalty Analytics Project Phases
To incrementally enhance the outcome, as per the approaches of similar data mining projects and advice from predictive analytics project planning (Hajiha, Radfar, & Malayeri, 2011; Rathburn, July 2012), a loyalty analytics project can be organized into five phases, as in Figure-1.
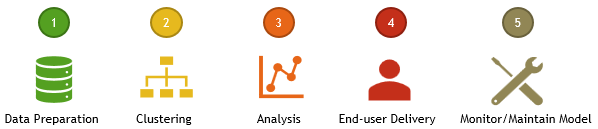
Phase I: The data preparation phase – In this phase, the data that can be used for the project is prepared by identifying the data sources and the datasets; identifying the right clustering algorithm; and calculating and normalizing variables to be used.
Phase II: The clustering phase – In this phase, the selected clustering algorithm will be applied to iteratively cluster the data and identify the effective variables on customers’ loyalty; and determine the right cluster number to segment the customers into homogenous groups by using data mining software.
Phase III: The analysis phase – In this phase, the value of each segment is analyzed whereby the weight of each variable is determined and the average value of each cluster is calculated; and also, suitable behavior policies targeting each segment are developed by the organization.
Phase IV: The end-user delivery phase – In this phase, the model analyzed in collaboration with the business experts will be packaged in a usable way and delivered for the end-users, for customer segmentation and performing target marketing activities.
Phase V: Model monitoring and maintenance phase – In this phase, the segmentation models developed in earlier phases will be monitored for their level of performance against business performance metrics; and a model maintenance schedule is established if the model degrades below the acceptable degradation threshold.
Phase I: The data preparation
Data preparation which involves identifying the data sources and datasets as per the purpose of the analysis and the applied algorithms requirements is the first step in a data mining project (Hajiha, Radfar & Malayeri, 2011). Without getting into the details of the data to be used for this project, to help assemble the datasets from the data sources, the business questions to be answered by the analytics should be defined; and the appropriate clustering algorithm should be identified.
- Define the business questions
In line with the objective of the project, which is creating customer segments to cluster customer into homogenous groups, we can pause the following business questions that will enable us to define the required datasets and identify the right clustering algorithm:
- What demographic characteristics would affect customers’ average-spending per quarter?
- Which customers are important frequent shoppers, with recent visits, to the company business?
To answer such business questions, data in the retail and grocery chain store systems should be closely analyzed, and the available data characteristics to be used in the analysis and the corresponding datasets should be defined. About each customer, suppose we have the following detail that can be extracted from the loyalty and grocery chain store system, for the purpose of this analysis.
- How often a customer shop
- What they have bought on their most recent shopping trips
- How much they spend on each trip
- The location of your stores that they frequent.
- The brands of the items they purchase.
- The packaging of the products they purchase. (size, volume, etc.)
- Their mode of payment. (debit, credit, cash, etc.)
- Their age, gender, and marital status.
- The zip code of their residence.
- Their income brackets.
- And other details obtainable by membership in a loyalty program.
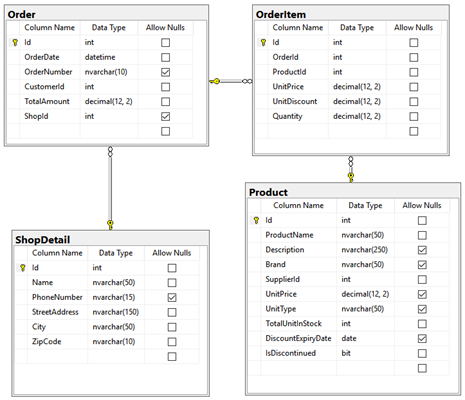
Based on the details provided in the assignment, one can assume that there are two data sources, the grocery chain system where daily store transactions, in the grocery chain stores, collected and stored; and the customer loyalty system, where customer-specific information gets collected and stored. Figure 2 could represent a partial view of the grocery chain system tables.
The customer table, in the customer loyalty system, where customers’ data could be collected into and retrieved from might be simplified as in Figure 3, below.
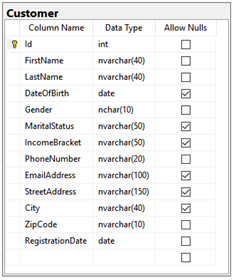
Figure 3. A simplified view of the customer loyalty system table
- Identify Datasets
Based on the two data sources, the grocery chain system and the customer loyalty system, briefly detailed using Figure 1 and Figure 2, different datasets that can be assembled from these sources and used for segmenting the customers into different clusters. To respond to the business questions posed in section 2.1. (a), two datasets are assembled as follows:
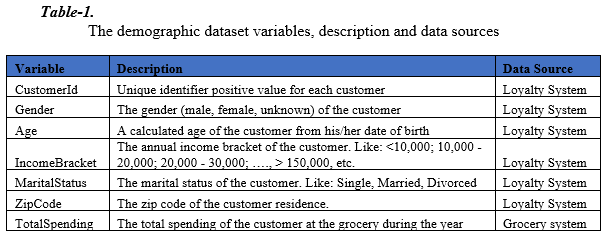
- The demographic dataset
To answer the business question 1, defined above, the demographic dataset detailed in Table 1 below can be used.
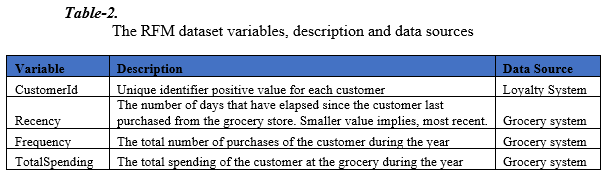
- The RFM dataset
To answer the business question 2, defined above, the recency, frequency and monitory value (RFM) dataset detailed in Table 2 below can be used.
- Define methods for variable calculation and normalization
Once the target datasets and corresponding variables are identified, since the raw data is different from the target variable in the dataset, variable calculation – to get the correct value of the dataset’s variable; and normalization – to adjust values measured on different scale, should be performed (Hajiha, Radfar, & Malayeri, 2011; Nikulin, Huang, & Lu, 2015; Rathburn, July 2012).
In the Demographic dataset, Age and TotalSpending variables require calculation for the raw data from the sources that don’t have these values as they are. Similarly, Recency, Frequency, and TotalSpending in the RFM dataset require variable calculation as well as variable normalization. Therefore, methods for variable calculation and normalization should be defined for the variable that needs extra treatment after they get loaded from the data sources.
- Perform data cleansing
Data cleansing is a process of cleaning a dataset so that the resulting data will be consistent with other similar datasets in the system. Before proceeding into the clustering phase, the data in the target dataset should be clean from missing values, extreme outliers, and invalid values, that would otherwise affect the business value of the resulting model. There are tools or modules like the Dplyr module (Tidyverse, n.d.) for R (RStudio, 2018) that can be employed for data cleansing.
Phase II: The clustering phase
Coffey (2016) explains that clustering creates groups from continuous variables and customer segmentation is often performed using unsupervised clustering techniques such as K-Means. Specifically, K-Means clustering is a popular unsupervised clustering technique that has commonly and effectively been used to partition customers into market segments for product positioning and new product developments. As a result, utilizing K-Means clustering for this project suits the characteristics of the target datasets, and can cluster the customers into groups with certain boundaries.
In this phase, the three steps with two major iterative refinement steps, assignment, and update, (Wikipedia, n.d.) of K-Means clustering can be performed using analytics software, with K-means clustering module, like RStudio (2018), or the Microsoft Power BI clustering (Cofsky, 2016):
- Assignment step: Each data point is randomly assigned to a cluster (number of clusters is given beforehand).
- Update step: Each cluster’s centroid, mean within-cluster, is calculated.
- Assignment step: Each data point is assigned to its nearest centroid, iteratively to minimize the within-cluster variation, until no major reassignments are found.
To determine the optimal number of clusters, the elbow method, which looks at the percentage of variance explained as a function of the number of clusters; and cross-validation method, which partitions the data into n parts with n-1 for clustering and 1 for testing or cross-validating the model should be employed.
Phase III: The analysis phase
For an analytics project to add business value, partnerships between the business experts and the analytics project team are of paramount importance (Viaene & Van den Bunder, Fall 2011). Therefore, this phase should be executed in collaboration with business experts, and involves the following steps:
- Determine the weight of variables in each dataset
- Calculate the average value of each cluster in each dataset
- Analyze and rank the clusters based on each cluster’s loyalty value to determine corresponding incentives, offers, and targeted promotions.
As suggested by Rathburn(July 2012), this phase gets concluded after successfully validating the resulting models’ performance against the business performance metrics established for this project and comparing the result with the performance levels achieved by the current decision process on the same dataset.
Phase IV: The end-user delivery phase
In this phase, the model analyzed in collaboration with the business experts, and the corresponding incentives, offers and targeted promotions defined in the analysis phase should be documented and packaged in a usable way, and delivered for the end-users, for performing customer segmentation and target marketing promotion activities.
Since Microsoft Power BI has the K-means clustering capability (Cofsky, 2016), and an intuitive dashboard, the K-means clustering model can be delivered using the Microsoft Power BI Dashboard. Moreover, in collaboration with the business experts who were involved in the analysis phase, business users’ training documents, on how to use the dashboard, should be prepared and presented for the end-users.
Phase V: The model monitoring and maintenance phase
Once a model is developed and delivered to end-users, the performance of the model will degrade due to the change in the behavior of customers or the business using the model. As a result, adopting a program for model monitoring and maintenance is advised (Rathburn, July 2012). As detailed by Rathburn, model degradation would be caused by:
- A change in the underlying nature of the behavior that the model is predicting
- Changes in the behavior of the customers
Therefore, in collaboration with the business experts, in this phase, a monitoring program should be defined, which can easily be adapted so that a change in either the behavior of the variable being predicted or the behavior of the customer can be monitored and take one of the following corrective actions:
- Building a new model – in case of a change in the behavior of the customer; or
- Updating the weight of variables – in case of a change in the behavior of the variables being predicted.
References
Coffey, K. (2016, August 13). kimberlycoffey. Retrieved from K-means Clustering for Customer Segmentation: A Practical Example: http://www.kimberlycoffey.com/blog/2016/8/k-means-clustering-for-customer-segmentation
Cofsky, A. (2016, November 28). Power BI Desktop November Feature summary. Retrieved from Microsoft Power BI: https://powerbi.microsoft.com/en-us/blog/power-bi-desktop-november-feature-summary/#clustering
Cognizant. (January 2014). Retail Analytics: Game changer for loyalty.
Hajiha, A., Radfar, R., & Malayeri, S. (2011). Data mining application for customer segmentation based on loyalty: An iranian food industry case study. 2011 IEEE International Conference on Industrial Engineering and Engineering Management, Industrial Engineering and Engineering Management (IEEM), 504-508.
International Institute for Analytics. (August 2014). Keeping customers: Sucessful loyalty through analytics.
Nikulin, V., Huang, T.-H., & Lu, J.-D. (2015). Mining Shoppers Data Streams to Predict Customers Loyalty. 2015 10th International Conference on Intelligent Systems and Knowledge Engineering (ISKE), 26-33.
Rathburn, T. A. (July 2012). Predictive analytics project design: A nine-step guide to realazing business value. Renton: TDWI.
RStudio. (2018). Choose Your Version of RStudio. Retrieved from RStudio: https://www.rstudio.com/products/rstudio/download/
Tidyverse. (n.d.). Dplyr. Retrieved from Tidyverse: https://dplyr.tidyverse.org/
Viaene, S., & Van den Bunder, A. (Fall 2011). The secrets to managing business analytics project. MITSloan Managment Review, 53(1), 65-69.
Wijaya, A., & Girsang, A. S. (2016). Use of Data Mining for Prediction of Customer Loyalty. CommIT Journal, 10(1), 41-47.
Wikipedia. (n.d.). k-means clustering. Retrieved from Wikipedia: https://en.wikipedia.org/wiki/K-means_clustering