By: Denekew A. Jembere
 Licensed under a Creative Commons Attribution-NonCommercial-ShareAlike 4.0 International License.
Introduction
The advent of personal devices and IoT sensors, that are capable of generating data, coupled with the need for extracting information from data has fueled the speed, frequency, and volume of data being collected by organizations. However, the quality of data being collected is less of a concern, upfront, when the infrastructure to collect the data is put in place. To extract useful information from data, data preparation deals with quality issues and would require a piece of domain knowledge to fix some of the inconsistencies in the data. When the size of data is big, in the case of big data, it would become very difficult for a domain expert to fix such quality issues. In this regard, Data Mining could play a role in identifying data inconsistency patterns, during the data preparation phase, and enable to fix the issues and increase the quality of the data.
This article will, therefore, outline the use of an Excel add-in, Solver, to optimize data after a manual preparation of an Excel data model and, explain the role of Data Mining in solving optimization problems in large data sets.
Analytic Solver for Excel
The solver is an Excel add-in software that helps users determine the best way to optimize resources where multiple decisions need to be made in the best possible way while simultaneously satisfying a number of logical conditions (or constraints). According to Solver (n.d.-e), the “best” or optimal solution might mean maximizing profits, minimizing costs, or achieving the best possible quality.
According to Solver (n.d.-a), analytic solver for excel has capabilities such as Data/text mining; conventional optimization; Monte Carlo Simulation; and stochastic and robust optimization. Depending on the type of problem to be optimized, there are three different types of optimization algorithms or methods that are supported in the Excel Solver add-in:
- LP Simplex method (Solver, n.d.-b). The Simplex Linear Programming (LP) algorithm is used for solving Linear Programming problems – mathematical models whose requirements are characterized by linear relationships, which consist of a single objective represented by a linear equation that must be maximized or minimized.
- Evolutionary method (Solver, n.d.-c): This algorithm is used for non-smooth problems in which some of the functions are non-smooth or discontinuous. Since it is difficult to determine the direction in which a function is increasing or decreasing, in such non-smooth problems, they are the most difficult type of optimization problems to solve.
- GRG Nonlinear method (Solver, n.d.-d). Generalized Reduced Gradient (GRG) Nonlinear algorithm is used for smooth nonlinear problems in which at least one of the constraints is a smooth nonlinear function of the decision variables.
Optimization using Solver
Based on the tutorial in Solver (n.d.-e), Table 1 shows data used for product mix optimization for maximizing the profit of a factory that produces four different types of wood paneling. As can be seen in the table, each type of paneling is made by gluing and pressing together a different mixture of pine and oak chips. For the given production cycle, the available resources and target profit from each paneling are provided.
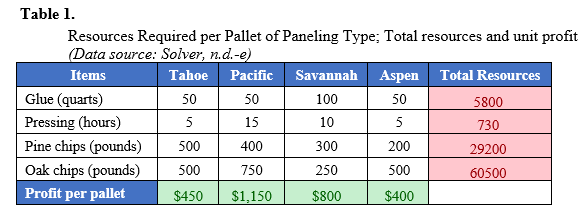
Given the profit per pallet and available resources for the production cycle to be optimized, the formulas for the total profit to be maximized and the constraints associated with the available resources can be written as follows:
Profit (Maximize) => 450 T + 1150 P + 800 S + 400 A
Constraints – Maximizing the profit is subject to:
50T + 50P + 100S + 50A <= 5800 (Glue)
5T + 15P + 10S + 5A <= 730 (Pressing)
500T + 400P + 300S + 200A <= 29200 (Pine chips)
500T + 750P + 250S + 500A <= 60500 (Oak chips)
T, P, S, A >= 0 (i.e., products built cannot be negative)
Where: T – Tahoe; P – Pacific; S – Savannah; A – Aspen.
The Excel Worksheet
In Figure 1, the Excel worksheet cells B4, C4, D4, and E4 are reserved for the decision variables, T, P, S and A representing the number of pallets of each type of panel to produce. In addition, the profit for each pallet of panels is entered in cells B5, C5, D5, and E5, which allows the total profit, objective, to be calculated in cell F5:
Total_profit, F5: = B5*B4+C5*C4+D5*D4+E5*E4 = SUMPRODUCT (B5:E5, B4:E4)
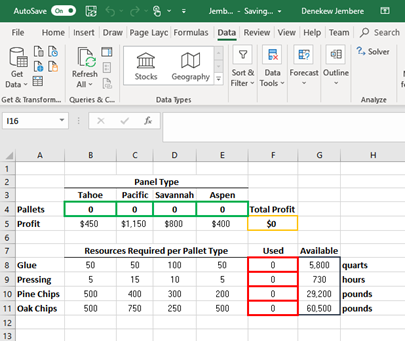
Cells B8: E11 (16 cells) – show the number of resources needed to produce a pallet of each type of panel. Formulas to compute the total amount of resources used (in F8, F9, F10, and F11) for each type of pallets to be produced are:
F8: = SUMPRODUCT (B8:E8, $B$4: $E$4)
F9: = SUMPRODUCT (B9:E9, $B$4: $E$4)
F10: = SUMPRODUCT (B10:E10, $B$4: $E$4)
F11: = SUMPRODUCT (B11:E11, $B$4: $E$4)
For readability and ease of reference for Solver Parameters, reference names are used for the target cell and cell ranges as F5–Total_Profit; F8: F11– Resources-Used; and, B4: E4– Number_to_produce. Figure 2 shows, the Solver Parameters dialog, using these representations.
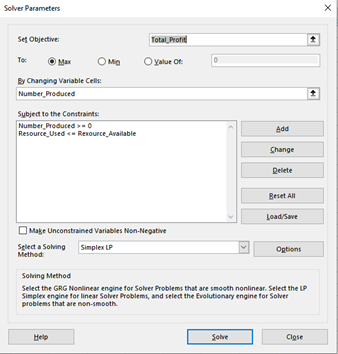
Since the dependent or objective variable, Total_Profit, has a linear relationship with the constraints, the algorithm used to maximize is Simplex Linear Programming (LP) algorithm. As a result, the maximized profit and associated details are shown below in Figure 3
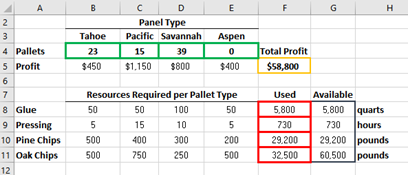
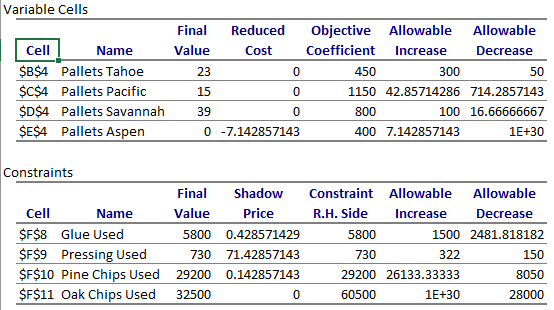
The optimal number of each type of pallet to be produced, in B4 through E4, which can maximize the profit is determined by the Solver LP algorithm using the formulas for F8 through F11, within the limits of the constraints, in multiple iterations. The sensitivity report of this optimization is given in Figure 4.
We have tackled this problem by combining data mining and linear programming approaches. We apply data mining to infer constraints that a feasible cutting pattern should obey, and we use these constraints in a linear programming formulation to determine the minimum number of mother plants that are needed to supply the demand.
Data Mining for optimization
In relation to data preparation, Teichmann et al (2010) a data preparation framework for transforming raw transactional clinical data to well-formed datasets for applying data mining. In this regard, data mining can be used for increasing the quality of a dataset through an automated process for data cleansing, variable reduction, cardinality reduction of data resulting in longitudinal datasets. In addition, logistic regression helps to develop a model that enables to predict the validity of the data against the actual outcome captured in the transactional system’s dataset.
In multiple resource or process optimization studies (Giraldo Mejía, 2017; Hoogeveen et al, 2019), using data mining methods and algorithms, such as creating a logistic regression model has become a common approach for increasing the quality of data, during data preprocessing. In relation to this, data mining can be used to infer constraints (Hoogeveen et al, 2019) based on patterns observed in the data. The resulting data mining output can then be used as input constraints for a linear programming formulation to optimize a product, in this case, flower, supply needed to satisfy the demand in the market.
References
Cheusheva, S. (2018, September 11). How to use Solver in Excel with examples. Retrieved from Ablebits: https://www.ablebits.com/office-addins-blog/2016/06/22/how-to-use-solver-in-excel-with-examples/#excel-solver-algorithms
Giraldo Mejía, J. C., Montoya Quintero, D. M., & Jiménez Builes, J. A. (2017). Knowledge-based model to support decision-making when choosing between two association data mining techniques. Revista Lasallista De Investigación, 14(2), 41-50.
Hoogeveen, H., Tomczyk, J., & van der Zanden, T. C. (2019). Flower power: Finding optimal plant cutting strategies through a combination of optimization and data mining. Computers & Industrial Engineering, 127, 39–44
Macarty, M. (2017, Apr 25). Linear Programming (LP) Optimization with Excel Solver. Retrieved from Youtube: https://www.youtube.com/watch?v=6xa1x_Iqjzg
Microsoft. (n.d.). Create a Data Model in Excel. Retrieved from Microsoft Office: https://support.office.com/en-us/article/create-a-data-model-in-excel-87e7a54c-87dc-488e-9410-5c75dbcb0f7b
Pinder, J. P. (2013). An Excel Solver Exercise to Introduce Nonlinear Regression. Decision Sciences Journal of Innovative Education, 11(3), 263–278.
Solver. (n.d.-a). Analytic Solver for Excel. Retrieved from FrontlineSolvers: https://www.solver.com/analytic-solver-platform
Solver. (n.d.-b). Excel Solver: Linear porgramming. Retrieved from FrontlineSolvers: https://www.solver.com/excel-solver-linear-programming
Solver. (n.d.-c). Excel Solver: Non-smoth optimization. Retrieved from FrontlineSolvers: https://www.solver.com/excel-solver-non-smooth-optimization
Solver. (n.d.-d). Optimization problem types: Smooth nonlinear optimization. Retrieved from FrontlineSolvers: https://www.solver.com/smooth-nonlinear-optimization#Smooth%20Nonlinear%20Optimization%20(NLP)%20Problems
Solver. (n.d.-e). Optimization tutorial – Step by step: Product mix example. Retrieved from FrontlineSolvers: https://www.solver.com/product-mix-example Teichmann, E., Demir, E., Chaussalet, T. (2010). Data preparation for clinical data mining to identify patients at risk of readmission. 2010 IEEE 23rd International Symposium on Computer-Based Medical Systems (CBMS), 184.