By: Denekew A. Jembere
 Licensed under a Creative Commons Attribution-NonCommercial-ShareAlike 4.0 International License.
Introduction
With data analysis tools and services, like SQL Server Analysis Services (SSAS), Excel, and R incorporating powerful data mining algorithms, data mining has become accessible for performing advanced data analysis. Ensuring the proper execution of the steps required for data mining, such as: data pre-processing to clean erroneous or nose data; selecting the correct data mining algorithm(s) for the dataset and the problem domain; and, careful interpretation of the usage and accuracy of the resulting data mining enable to realize the benefits of data mining.
The ease of creating and training a data mining algorithm-based model, without due attention to the algorithm’s detail could lead to misinterpretation of the resulting details or using the wrong algorithm for a task. This article will outline data preprocessing, training data mining algorithms that are used to find correlations between different attributes in a dataset and, comparing the details of the resulting models using lift chart and cross-validation values.
Choosing the dataset
For this exercise, an attempt was made to use a relatively large dataset. However, the size of the data became a bottleneck during data preparation, deployment and training data mining models onto SQL Server Analysis Service (SSAS) data mining algorithms. As a result, the lessons learned from the exercise reported, and a fictitious dataset published by Microsoft (2017), the AdventurWorksDW sample database, got used to performing the data mining exercise.
Lesson from choosing a very large dataset
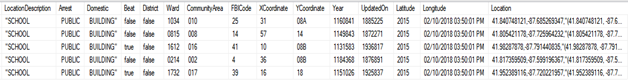
For mining, some hidden patterns from the huge amount of historical data, the crime dataset for the city of Chicago (Data.gov, 2018) was found to be interesting. After importing the data into a SQL database, an initial assessment of the data got performed. Based on the initial assessment and performing quick simple queries, the total records of the dataset were found to be 6779002 with a total of 20 attributes. A closer inspection of the data revealed 189557 of the records had misplaced values caused by quoted but comma-separated-values, like “SCHOOL, PUBLIC, BUILDING” as shown in Figure 1, ending up in three columns and pushing subsequent column values and, concatenating values of the last three columns into one.
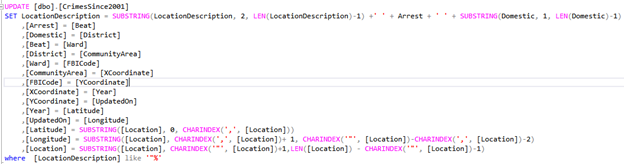
Although a query, shown in Figure 2, was written to fix the data, executing the query for close to 3hrs didn’t finish the fix due to the size of the data. As a result, the 189557 records got deleted from the original dataset, and the remaining 6529638 records got published to a SQL Server analysis service (SSAS) cube for data mining, using the SSAS data mining algorithms. However, since the size of the data once again became a bottleneck for deploying any of the SSAS data mining algorithm structures created to train data mining models, the AdventurWorksDW database (Microsoft, 2017) got used to performing the data mining exercise.
The datasets used for data mining
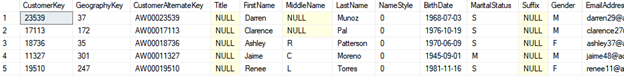
The AdventurWorksDW database (Microsoft, 2017) is one of the fictitious sample databases published by Microsoft, having 35 tables and views and, is used to explain different business intelligence as well as data mining algorithm practical examples. The datasets used to train different SSAS data mining algorithms, whose partial schema is shown in Figure 3, is the vTargetMail which has 18,484 records represented by 32 attributes.
The data mining algorithms
According to Priyanka and RaviKumar (2017), data mining has got two most frequent modeling goals, classification & prediction, for which Decision Tree and Naïve Bayes algorithms can be used to create a model that can classify discrete, unordered values or data.
Decision Tree
According to Wikipedia (n.d.-a), a Decision Tree is a decision support tool that contains conditional control statements in a tree-like model of decisions with their possible consequences, chance event outcomes, resource costs, and utility. With the objective to reduce the uncertainty in data, Mabe-Madisa (2017) explains that making a choice of a node (or attribute) to branch out is the important decision to make about Decision Trees.
Naïve Bayes
According to Wikipedia (n.d.-b) and Utama et al (2018), Naive Bayes is a simple probabilistic technique for constructing models that assign class labels to problem instances, which are represented as vectors of feature values, where the class labels are drawn from some finite set. In this regard, P. G., Sreenath (2015) explains, Naïve Bayes’ assumption of the conditional independence of attributes simplifies the probabilistic representation of each instance in the dataset and enables to accommodate missing values and, avoiding model overfitting.
The data mining tools and services
Since the selected data mining algorithms, Decision Tree and Naïve Bayes, are supported by Microsoft tools and services, the process of creating and training the data mining models, on the selected dataset, is performed using Microsoft tools. The tools used are- Microsoft Visual Studio 2018; Microsoft SQL Server Management Studio (SSMS); the Microsoft SQL Server; and, Microsoft SQL Server Analysis Services.
The data mining analysis
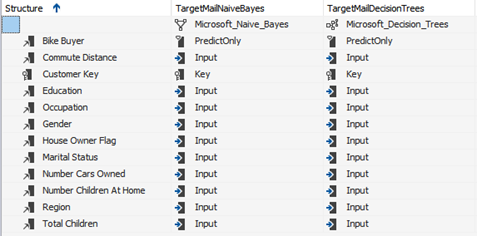
To create, train and test the data mining models using the Decision Tree and Naïve Bayes algorithms, the vTargetMail dataset is closely inspected and, the dependent and independent attributes, as well as the training and holdout data percentages, got defined. As a result, out the 35 attributes of the dataset, 11 independent attributes with discrete values and one dependent (Bike Buyer) attribute got selected, as shown in Figure 4. In addition, the 18,484 records of the dataset got divided into 70% and 30% model training and model accuracy-test sets, respectively, for SSAS to randomly partition the dataset into the training and test sets.
Analyzing the resulting models
According to Heckerman et al (2001) and Shum (2006), dependency networks are useful graphically displaying predictive relationships and for predicting preferences or collaborative filtering. As can be seen in Figure 5, the trained models show different attribute dependency orders, between independent variables to explain the dependent attribute, Bike Buyer.
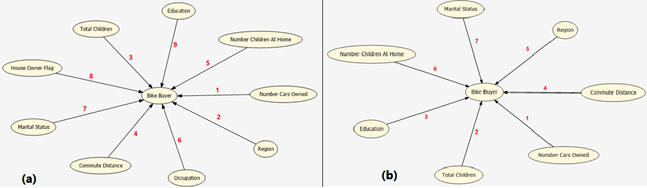
Although both the models show that the Number of Cars Owned is the most important (i.e. 1st) attribute to explain the dependent attribute, Bike Buyer, the dependency networks become different for the attributes, with some of the attributes not existing in the Naïve Bayes network.
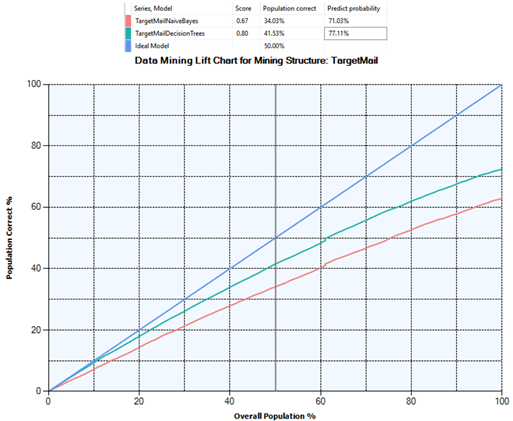
In their study, Shahinfar et al (2015) used a lift chart for analysis and cost-sensitive evaluation of correctly classified and misclassified data points and, noted that it could enhance the performance and profitability business. In line with the remarks of Shahinfar et al, the lift chart shown in Figure 6 can be used to compare the two models, Decision Tree, and Naïve Bayes, for the best predictor results. As can be seen in Figure 6, the prediction probability of Decision Tree is slightly better than Naïve Bayes prediction probability, for the given dataset.
Cross-Validation (McCaffrey, 2013) results with a 10-fold run with the maximum cases set be 10,000, and the target state of the dependent attribute to be 1, the average and standard deviation of the two models, the Decision Tree, and Naive Bayes, are summarized in Table1.
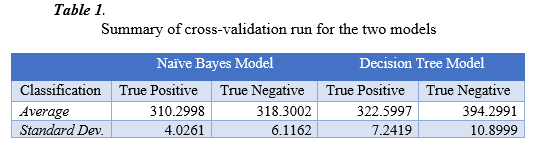
As can be seen in Table 1, the Decision Trees model gives better average values (i.e., better accuracy) for predicting true positives and true negatives, as compared to the Naïve Bayes model. On the other hand, the Naive Bayes model’s standard deviation values are smaller, which means the model’s prediction doesn’t get affected by data change (i.e., robust model). Therefore, depending on these values and the business nature of the dataset (i.e., change frequency), either of the models can be chosen for future prediction.
Usage in real-world
Data mining models can be used for predictions or for data pre-processing and identifying attribute relationships, for further analysis, as observed in the dependency network of the Decision Tree and Naïve Bayes models evaluated above. The models that got evaluated in this article can be used for the determination of likely bike buyers whereby enabling the business to be cost-effective in its advertisement budget; or evaluation of a new bike brand expansion opportunities for the business.
References
Data.gov. (2018, August 9). Crimes – 2001 to present. Retrieved from Data Catalog: https://catalog.data.gov/dataset/crimes-2001-to-present-398a4
Heckerman, D., Chickering, D. M., Meek, C., Rounthwaite, R., & Kadie, C. (2001). Dependency Networks for Inference, Collaborative Filtering, and Data Visualization. Journal of Machine Learning Research, 1(1), 49–75.
Mabe-Madisa, G. V. (2018). A Decision Tree and Naïve Bayes algorithm for income tax prediction. African Journal of Science, Technology, Innovation & Development, 10(4), 401
McCaffrey, J. (2013, October 24). Understanding and Using K-Fold Cross-Validation for Neural Networks. Retrieved from Visual Studio Magazine: https://visualstudiomagazine.com/articles/2013/10/01/understanding-and-using-kfold.aspx
Microsoft. (2017, December 17). AdventureWorks sample databases. Retrieved from Github: https://github.com/Microsoft/sql-server-samples/releases/tag/adventureworks
P. G., Sreenath, G., Praveen Kumare, Sundar, Pravin, K. N., Vikram, M., Saimurugan.(2015). Automobile Gearbox Fault Diagnosis using Naive Bayes and Decision Tree Algorithm. Applied Mechanics & Materials, 813/814, 943
Priyanka, N., RaviKumar, Pushpa. (2017). Usage of data mining techniques in predicting the heart diseases — Naïve Bayes & decision tree. 2017 International Conference on Circuit ,Power and Computing Technologies (ICCPCT)
Shahinfar, S., Guenther, J. N., David Page, C., Kalantari, A. S., Cabrera, V. E., Fricke, P. M., & Weigel, K. A. (2015). Optimization of reproductive management programs using lift chart analysis and cost-sensitive evaluation of classification errors. Journal of Dairy Science, 98, 3717–3728
Shum, Wing-Ho, Leung, Kwong-Sak, Wong, Man-Leung. (2006). Learning acyclic decision trees with Functional Dependency Network and MDL Genetic Programming. International Multi-Conference on Computing in the Global Information Technology – (ICCGI’06)
Utama, R. A., Sukarno, P., Jadied, E. M. (2018). Analysis and Classification of Danger Level in Android Applications Using Naive Bayes Algorithm. 6th International Conference on Information and Communication Technology (ICoICT), 281
Wikipedia. (n.d.-a). Decision tree. Retrieved from Wikipedia: https://en.wikipedia.org/wiki/Decision_tree Wikipedia. (n.d.-b). Naive Bayes classifier. Retrieved from Wikipedia: https://en.wikipedia.org/wiki/Naive_Bayes_classifier